
Insights
Green hydrogen will be prohibitively expensive for a decade longer than anticipated
3 April 2025
The IEA predicted that the cost of green hydrogen produced from the main sources of renewable electricity (onshore wind, offshore wind and solar PV) can be as low as ca. $3.5-5/kg H2 in 2023 (Figure 1). Additionally, the lower cost bound of green hydrogen was predicted to be as low as $2-3/kg H2 in 2030, assuming a Net Zero emissions scenario will be achieved by 2050 (Figure 1). Both values are still a significant way off competing with the 2023 lower bound cost of grey hydrogen ($0.8/kg H2), which begs the question: when will green hydrogen become economically viable.
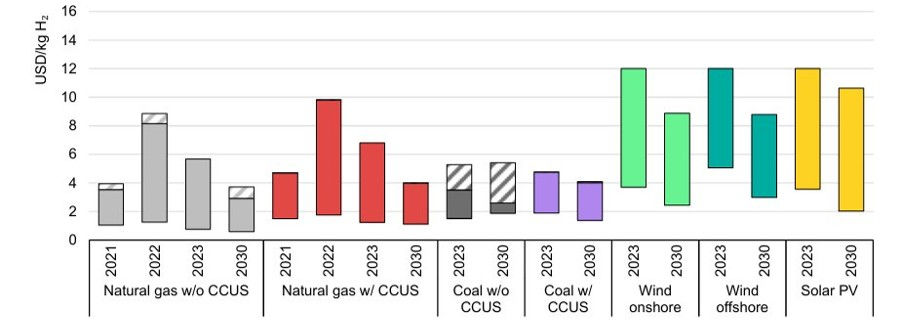
Figure 1: Hydrogen production cost by pathway, 2023 and in net-zero emissions by 2050 scenario, 2030 [1]
H2 is considered as a promising energy vector due to its high specific energy (energy per unit mass) and lack of CO2 emissions when combusted or used in a fuel cell to provide power
For the carbon reduction benefits to be truly realised, the hydrogen used must be “green hydrogen”, which is produced through the electrolysis of water. The electricity used must be renewable (e.g. generated from wind or solar) for the hydrogen produced to be classed as “green”. A previous WSS article, “Green hydrogen production: a few thoughts on promises and challenges”, addresses some of the challenges associated with using fresh or seawater.
Hydrogen has a potential role to play in the decarbonisation of a variety of sectors. One such example is as an energy store, in particular acting as a solution to seasonal renewable energy balancing – if effective methods for high-volume storage can be commercialised. There is also extra incentive to harness this surplus energy from a financial perspective. To prevent overloading the UK grid during times of excess renewables production, the government has been paying windfarm operators significant curtailment fees (over £2bn since 2021 [2]) for operators not to produce energy.
Although hydrogen has a lot of energy per unit mass, it is an extremely small molecule, meaning its energy per unit volume is low. As both maritime and aviation are extremely energy intensive, often attention turns to more energy dense (volumetric) fuels. However, promising candidates include e-ammonia and e-SAF (sustainable aviation fuel), which both require a source of green hydrogen. Companies such as Infinium and Norsk e-Fuel are bringing e-SAF product to the market.
Factors influencing green hydrogen production cost
For the levelised production cost of green hydrogen (Figure 2), the key cost drivers are the procurement cost of renewable electricity and electrolyser CAPEX [3].
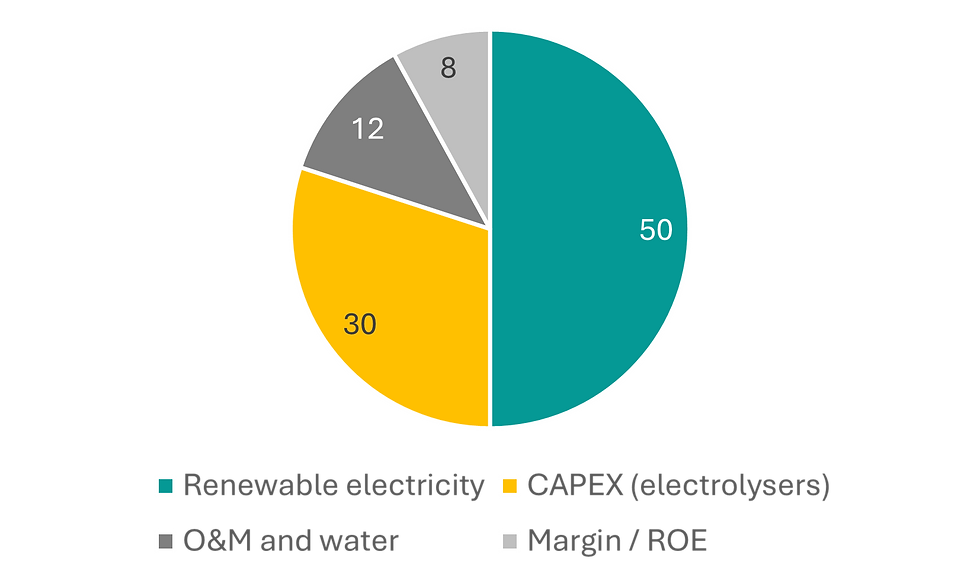
Figure 2: Green hydrogen levelised production cost breakdown
LCOE vs PPA
The cost of renewable electricity is often described as the levelised cost of electricity (LCOE). This is calculated by taking the net present value of the total cost of building and operating the renewable electricity generating asset and dividing it by the total electricity generated over its lifetime. Some of the factors considered in the LCOE calculation are upfront investment expenditures, financing costs, O&M costs and fuel costs [4]. This is therefore a theoretical, average measure of cost to produce electricity, which is an accepted way of comparing renewable assets and assessing whether a project is likely to be profitable and worth pursuing.
In terms of the actual price for a unit of renewable electricity, these are often set in contracts termed “Power Purchase Agreements” (PPAs). These are long-term contracts between electricity buyers (offtakers) and electricity suppliers. The PPA will define the price per unit energy from a renewable asset that the supplier will receive [5]. Benefits of PPAs include an often cheaper price than grid electricity, it enables offtakers to hedge against rising and fluctuating electricity prices in the wholesale market [6] and gains renewable energy certificates (US) / guarantees of origin (EU) to meet sustainability goals and comply with carbon reduction regulations.
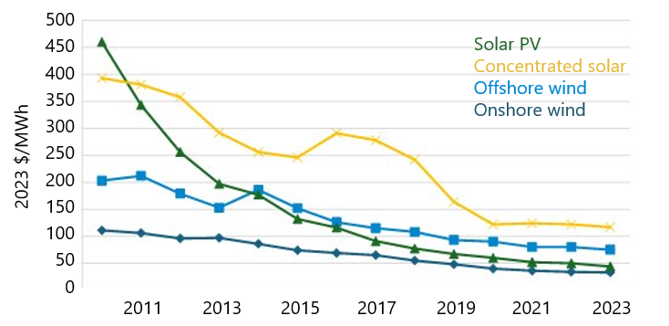
Figure 3:Global LCOE ($/MWh) from 2010 to 2023
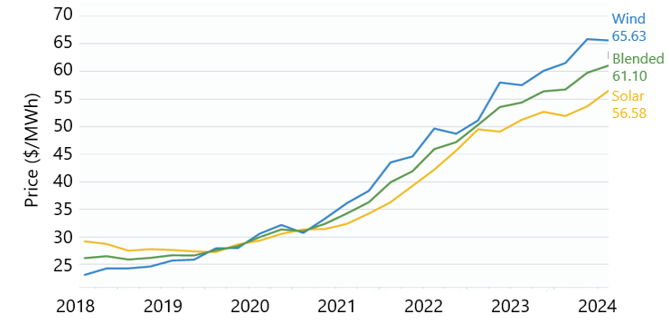
Figure 4: PPA price ($/MWh) for wind and solar in North America from 2018 to 2024
Opposing trends are observed for the two different metrics; LCOE (theoretical) and PPA price (what people are willing to pay), over time (Figure 3 and 4, respectively). The key drivers for LCOE decline include technological advancements in renewable assets, larger projects with more streamlined supply chains, reduced financing costs as the renewables market matures leading to lower perceived risk, government subsidies and tax incentives and learning curve effects. Considering that LCOE is a theoretical value and based on assumptions, PPA price is a more accurate metric in the near-term as it reflects current market conditions including demand and competition – some of which may be difficult to capture in LCOE [7]. The increase in PPA price observed from 2018 to 2024 is perhaps due to the high demand and hence competition for renewable electricity and/or the cost of managing curtailments, which are increasing as the renewable electricity grid share increases. Supply chain pressures such as rising critical material prices and geopolitical tensions could also lead to this increasing PPA price. It is essential that this trend is reversed if green hydrogen is to become viable from a cost perspective.
Electrolyser CAPEX (Demand / economies of scale)
The second largest contributor to the overall levelised production cost of hydrogen is the electrolyser CAPEX. Assuming a significant increase in demand, as forecasted for post-2030 (Figure 5), a mutual benefit of CO2 emission reduction and decrease in electrolyser costs can be achieved via economies of scale (Figure 6). Decreasing costs would be attributable to large manufacturing volumes decreasing overhead cost contribution, factory processes, improvement in utilisation of equipment (i.e. increased production volume from each unit) and improvement in process yield (reducing losses) [8].
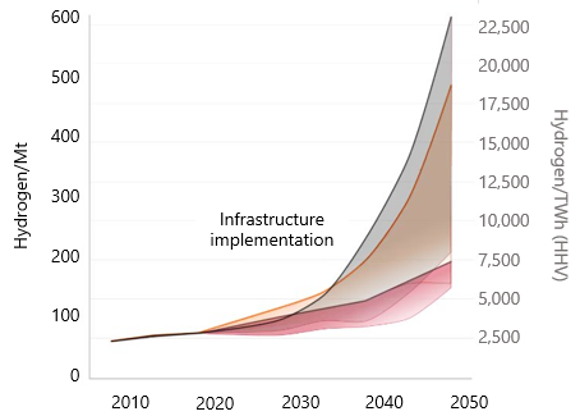
Figure 5: Profile of global green hydrogen demand up to 2050. Coloured regions link demand to global temperature increase. Grey - < 1.8°C, orange – 1.8-2.3°C and red >2.3°C [9]

Figure 6: Cost breakdown for 1MW PEM electrolysers as a function of manufacturing scale [8]
A variety of industries are driving the increased hydrogen demand:
Hard to abate sectors that have limited electrification potential, e.g. iron and steel, chemicals and cement
Renewable energy integration: green hydrogen can act as an energy store to balance intermittent renewable sources such as wind and solar
Transportation: heavy-duty vehicles (e.g. trucks and buses) are adopting hydrogen fuel cells
Power generation: green hydrogen is being used for grid-scale storage and as a combustion fuel in gas turbines
To facilitate the demand, electrolyser manufacturers are racing to increase their production capacities. This has been led by China, with the top 3 largest electrolyser companies, LONGi, Peric and Sungrow (annual capacity > 1GW) all residing there. This results in significantly cheaper electrolysers in comparison to Western alternatives (ca. 75% less [10]). In addition to increased electrolyser production capacity, pipelines compatible for hydrogen transport and construction of ports and export terminals need to be in place to meet this expected increased demand.
Electrolyser CAPEX (Technology advancement)
The two most advanced types of electrolysers are proton exchange membrane (PEM) and alkaline. A significant proportion of the CAPEX for both types can be attributed to the “stack” (ca. 25 – 37% [11]). Electrolyser stacks are a complex assembly of components at the heart of an electrolyser. The stack is made up of the following:
Electrodes – one positive (anode) and one negative (cathode) made of materials such as titanium or nickel, coated with a catalyst to enhance the electrochemical reactions that occur on their surfaces
Electrolyte – a substance that allows ions to move freely between the anode and cathode
Current collectors – essential for efficient distribution of electrical current throughout the stack
Separator plates – these are placed between individual cells within the stack to prevent mixing of gases and to ensure a clear path for the generated hydrogen and oxygen to their collection points
Gaskets and seals – prevent leakage of electrolyte and gases
Pressure management system – to control the pressure of hydrogen and oxygen in the system during operation of the stack
Cooling system – to maintain an optimal operating temperature
Power supply – provides the electrical energy required for electrolysis
At the CAPEX level, the current predicted electrolyser cost trends indicate a significant reduction until 2030 (Figure 7). In order to meet this cost reduction, technological enhancements of the stack will need to be realised (Table).
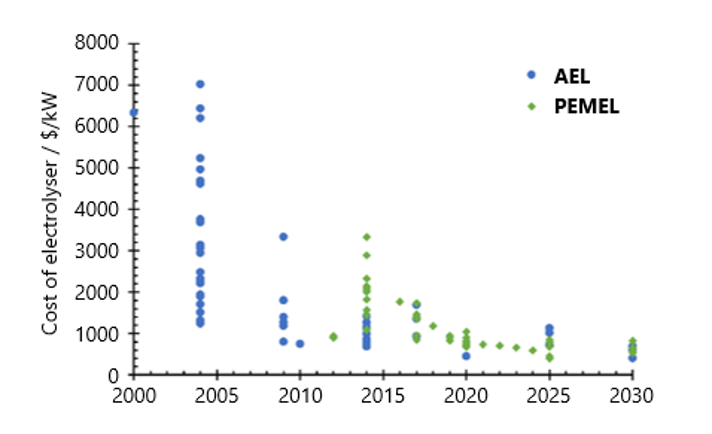
Figure 7: Alkaline (AEL) and PEM (PEMEL) electrolyser cost trend over time [12]

Table: Stack enhancements with the greatest potential to lead to a reduction of the electrolyser cost
Reducing the use of rare earth metals in electrolysers will reduce the cost of electrolysers and enhance deployment of hydrogen technologies. PEM electrolysers require platinum, palladium and iridium, whose production may struggle to meet the future demand from electrolysers. In particular, iridium production for electrolysers reached 6.8 metric tonnes in 2022, however, the demand is expected to reach 808 metric tonnes in 2024 [13]. With this said, future rare-earth demand from electrolysis may be overestimated as use efficiencies are expected to improve due to being a focal point for R&D. This is evidenced by start-up company, Bspkl whom are developing catalyst coated membranes with 25 times less iridium and platinum compared to traditional designs [14]. Furthermore, Clean Power Hydrogen (CPH2) has developed a membrane-free electrolyser that requires no platinum group metals [15].
System components of electrolysers vary in their fraction of total system cost and potential for cost reduction. Take PEM for example, the porous transport layers (PTLs) offer a higher potential for cost reduction but make up a lower fraction of the total cost in comparison to bipolar plates. It is therefore important to take a targeted approach when seeking to improve electrolysers for cost benefits. Stack replacement is also a significant cost contributor and will vary considerably on the electrolyser size and type. The Department of Energy (DoE) in the U.S. suggests that replacement stack costs equate to 11% of the total installed capital costs and are assumed to be incurred every 40,000 hours of operation [16]. BEIS (UK) suggest that stack replacement costs make up for 60% (PEM) and 50% (alkaline) of the plant CAPEX and are assumed to need replacement every 11 (PEM) and 9 (alkaline) years over a 30-year technology lifetime [17].
OPEX (downtime)
Minimising electrolyser downtime is key for maximising efficiency and lengthening operational life, both of which can lead to a reduction in green hydrogen cost. Process control and projections of electrolyser status can be monitored by chemical (raw materials e.g., water) and physical-electrical parameters (e.g., temperature and flow). In addition, the voltage of the individual cells are of significant importance. Changes in performance can be spotted at an early stage through precise monitoring, allowing more proactive maintenance and prevention of major damage [18]. The systems for monitoring individual cell voltages in electrolyser stacks are called Cell Voltage Monitoring (CVM) systems. Such systems are offered by Smart TestSolutions [19].
In our opinion, it is expected that the green hydrogen cost reduction predicted by the IEA in 2030 ($2-3/kg H2) is very unlikely to materialise without financial subsidies in place
The main drivers for this conclusion include the volatility and increasing cost trend observed for renewable electricity cost (PPA price - Figure 4). In addition, the continued use of expensive rare earth metal catalysts, especially in PEM electrolysers, along with other components that lead to high stack and stack replacement cost.
Other industry practitioners also share a similar concern [20]: Benjamin Haycraft (Executive Vice President for EMEA, Plug Power) - “The price of renewable electricity for multiple reasons will probably increase”, noting that since power represents ca. 60% of the cost of producing hydrogen via electrolysis, this would counteract any efficiency or capex gains on the electrolyser
However, when it comes to green hydrogen, we do believe there is longer term potential for cost reduction. The significant increase in projected green hydrogen demand needs to be enabled through increased electrolyser manufacturing which would lead to economies of scale. Technological advancement of the electrolyser components (stack) to reduce the dependency on expensive critical materials and increase operational efficiency, will also be a key driver in reducing electrolyser capex and hence hydrogen cost in the longer term.
References:
[1] Remme, U. Global Hydrogen Review (2024)
[2] Green Economy | What to do with the UK’s wasted wind energy. Green Economy https://www.greenintelligence.org.uk/news-and-resources/news/what-to-do-with-the-uk-s-wasted-wind-energy/.
[3] Green & Blue Hydrogen: Current Levelized Cost of Production, Market Trends & Outlook | GEP Blog. https://www.gep.com/blog/strategy/Green-and-blue-hydrogen-current-levelized-cost-of-production-and-outlook.
[4] Levelised Cost of Energy (LCOE) – An overview – Pexapark. https://pexapark.com/blog/lcoe/.
[5] What Is a Power Purchase Agreement (PPA)? | IBM. https://www.ibm.com/think/topics/power-purchase-agreements (2024).
[6] Different Types Of Power Purchase Agreements (PPAs) Explained | Future Energy Go. https://futureenergygo.com/different-types-of-power-purchase-agreements-ppas/ (2022).
[7] Valuing renewables as a long-term price hedge, even in an era of low natural gas prices.
[8] IRENA. Green Hydrogen Cost Reduction: Scaling up Electrolysers to Meet the 1.5C Climate Goal.
[9] PricewaterhouseCoopers. Green hydrogen economy - predicted development of tomorrow. PwC https://www.pwc.com/gx/en/industries/energy-utilities-resources/future-energy/green-hydrogen-cost.html.
[10] Klevstrand, A. Chinese companies take top three slots in BNEF’s list of world’s 20 largest hydrogen electrolyser makers. hydrogeninsight.com https://www.hydrogeninsight.com/electrolysers/chinese-companies-take-top-three-slots-in-bnefs-list-of-worlds-20-largest-hydrogen-electrolyser-makers/2-1-1355610 (2022).
[11] Electrolyser cost | European Hydrogen Observatory. https://observatory.clean-hydrogen.europa.eu/hydrogen-landscape/production-trade-and-cost/electrolyser-cost.
[12] Reksten, A. H., Thomassen, M. S., Møller-Holst, S. & Sundseth, K. Projecting the future cost of PEM and alkaline water electrolysers; a CAPEX model including electrolyser plant size and technology development. Int. J. Hydrog. Energy 47, 38106–38113 (2022).
[13] Are There Enough Critical Minerals for Hydrogen Electrolyzers? The Breakthrough Institute https://thebreakthrough.org/issues/energy/are-there-enough-critical-minerals-for-hydrogen-electrolyzers.
[14] Bspkl. bspkl https://www.bspkl.co.
[15] Home • CPH2. https://www.cph2.com/
[16] DOE Hydrogen Program Record.
[17] BEIS. Hydrogen production costs 2021.
[18] Learn How to Reduce Electrolyser Downtime. Hydrogen Central https://hydrogen-central.com/learn-how-to-reduce-electrolyser-downtime/ (2023).
[19] Cell Voltage Monitoring for Electrolysers | Hightech solutions for measurement, testing and simulation. https://www.smart-testsolutions.de/en/electrolysers.html?utm_source=onlinead&utm_medium=hv&utm_id=CVM_electrolysis.
[20] Martin, P. Cost of green hydrogen unlikely to fall ‘dramatically’ in coming years, admit developers. hydrogeninsight.com https://www.hydrogeninsight.com/production/cost-of-green-hydrogen-unlikely-to-fall-dramatically-in-coming-years-admit-developers/2-1-1523281 (2023).